1.9.0
Load test results
Note that the results largely depend on the environment and the implementation. Even though the results are not directly comparable, they can still be used to get a rough idea of the performance. To see if the performance is sufficient for your use case, you should always do your own tests.
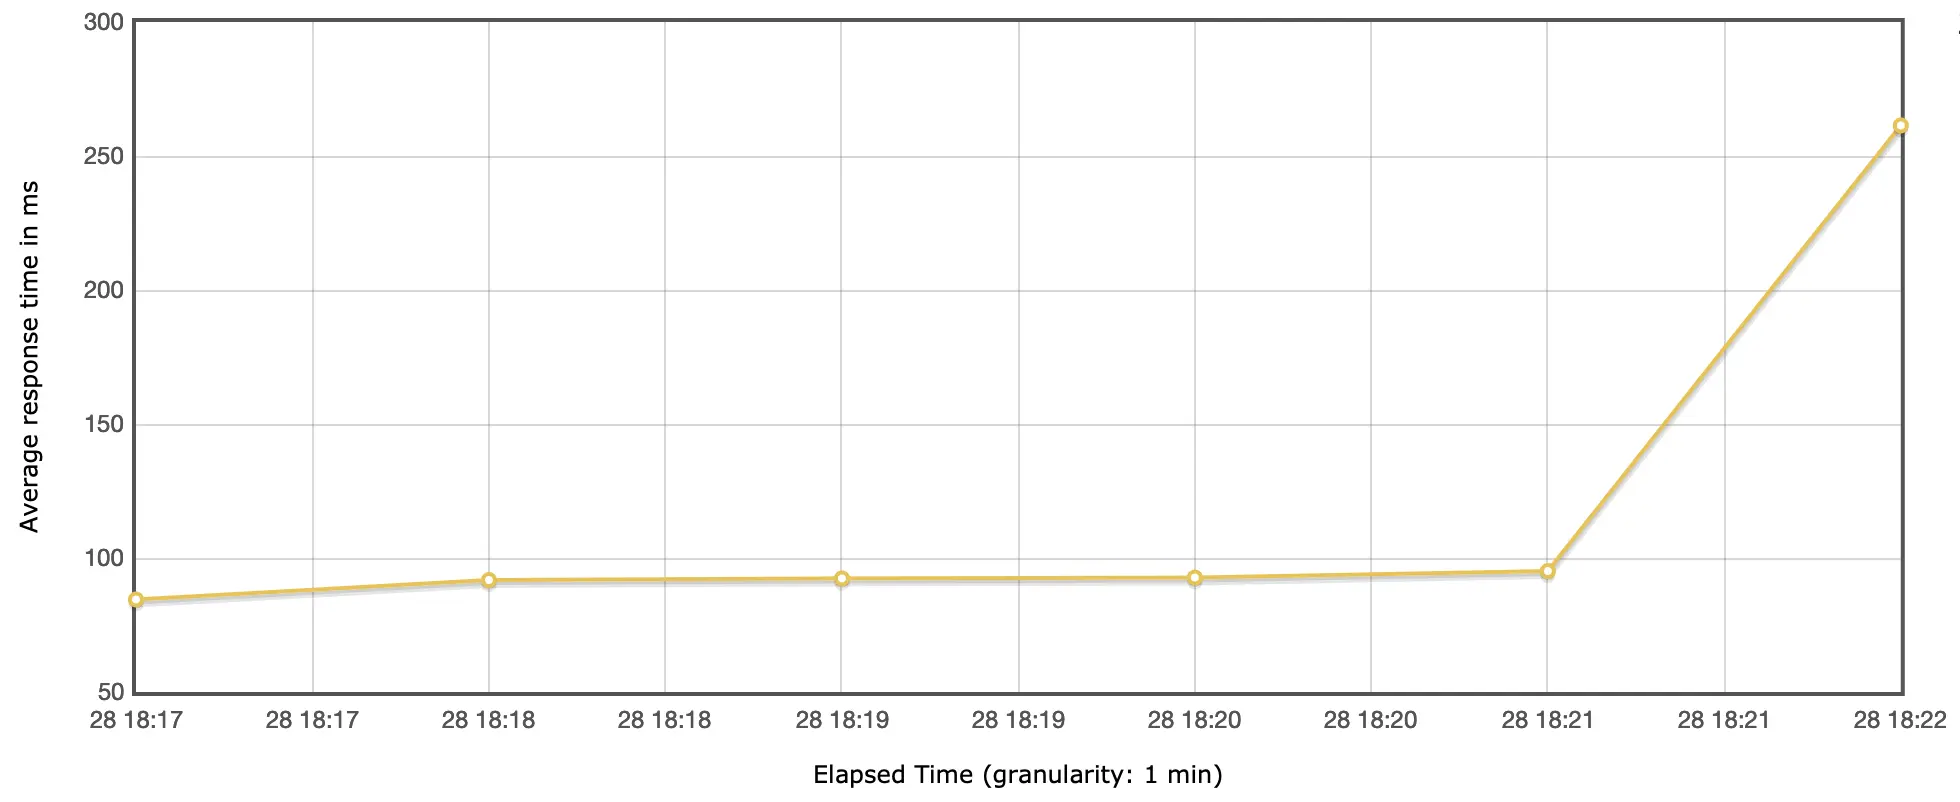
The tests where executed with the LoadTestExample, Unity Main Thread synchronisation and on a 8-core CPU (16 vCPUs) with a nVidia 2060. When Unity Main Thread synchronisation is needed, the amount of frames are important. Therefore the default VSync has been disabled for the test. The test was run on two machines, one acting as client and another acting as server. The client used 1.000 threads over five minutes to access the server.
With Unity Main Thread synchronisation (the last value has JMeter tear down overhead included):
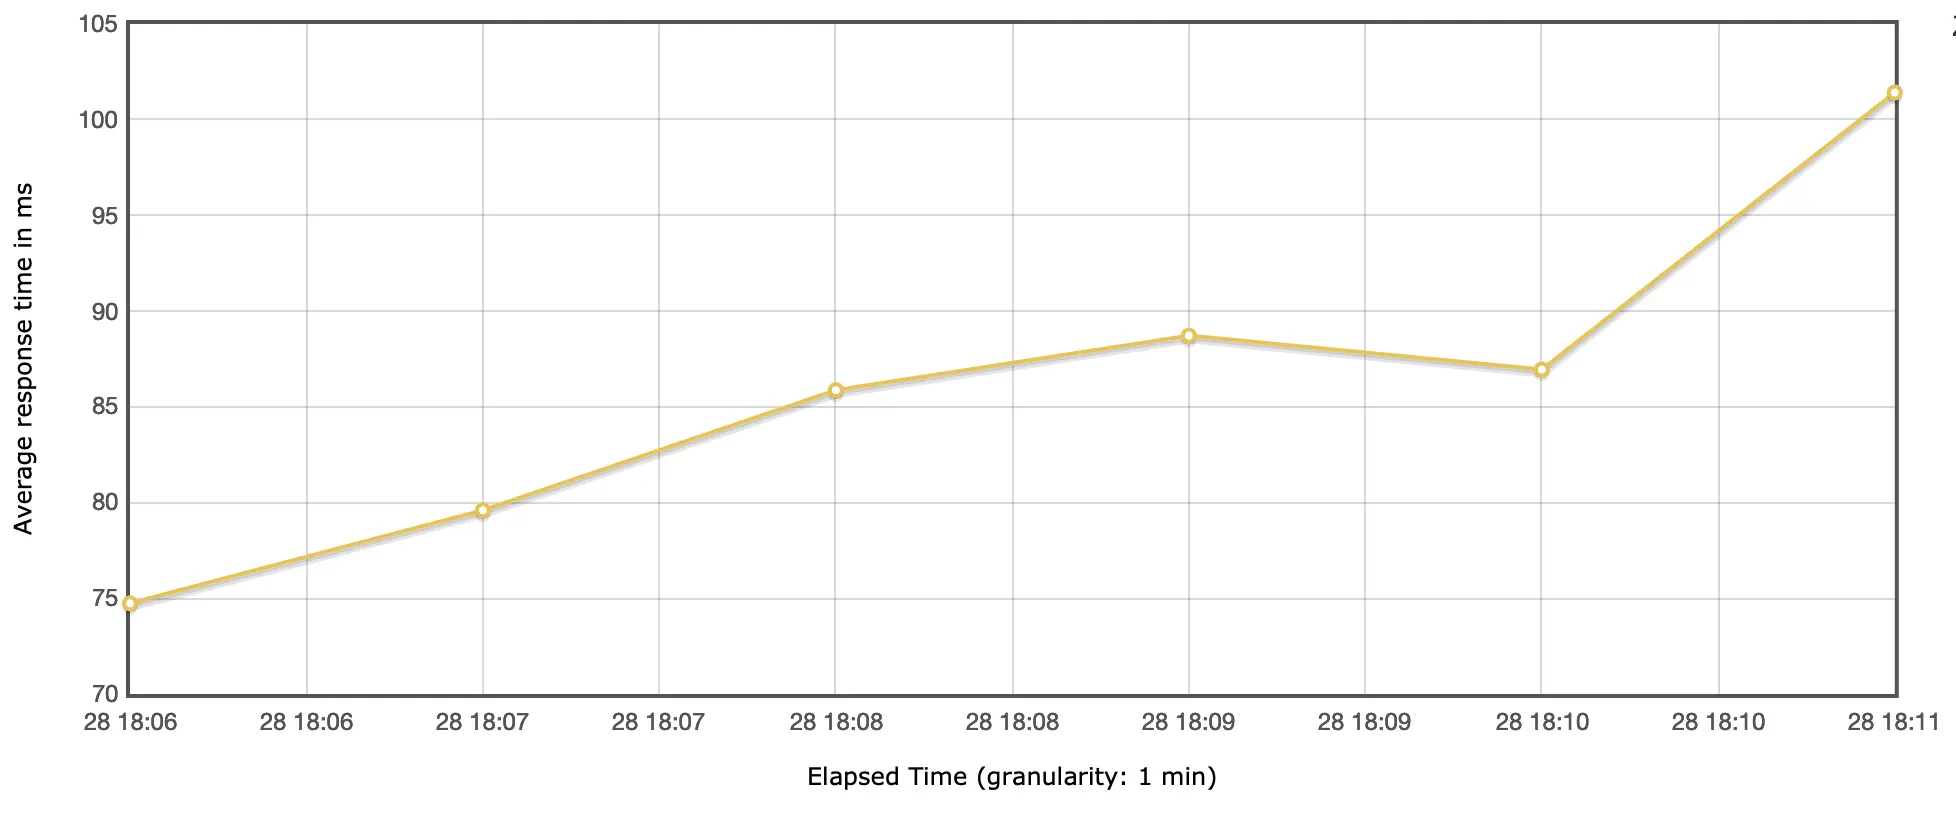
Without Unity Main Thread synchronisation (the last value has JMeter tear down overhead included):
1.6.0
Migration to Response Builder
Starting with 1.6.0 the old SendAsync methods are marked deprecated. Unity will warn if the project uses the old methods.
If the project needs to postpone the migration and silence the warnings, the define DISABLE_OBSOLETE_WARNING_OLD_RESPONSE_METHODS
can be added to “Player Settings -> Platform -> Other Settings -> Scripting Define Symbols”.
Each obsolete warning lists how to convert the calls, additionally the table below lists the transformation:
| Old | New |
|---|---|
SendAsyncGetResponse | request.CreateResponse().Body(content).SendAsync() |
SendAsyncErrorResponse | request.CreateResponse().StatusError().Body(content, contentType).SendAsync() |
SendAsyncGetJsonResponse | request.CreateResponse().BodyJson(obj, contentType).SendAsync() |
SendAsyncGetResponse | request.CreateResponse().Status(status).Body(content).Headers(headers).SendAsync() |
SendAsyncGetResponse | request.CreateResponse().Status(status).Body(content).Headers(headers).SendAsync() |
SendAsyncOkResponse | request.CreateResponse().SendAsync() |
SendAsyncHeadResponse | request.CreateResponse().SendAsync() |
SendAsyncOptionsResponse | request.CreateResponse().Header(HttpHeader.ALLOW, \“HEAD,GET,POST,PUT,DELETE,OPTIONS,TRACE\”).SendAsync() |
SendAsyncTraceResponse | request.CreateResponse().Body(content, MimeType.MESSAGE_HTTP).SendAsync() |
SendAsyncTraceResponse | request.CreateResponse().Body(content, MimeType.MESSAGE_HTTP).SendAsync() |
SendAsyncDefaultInternalServerError | request.CreateResponse().InternalServerError().SendAsync() |
SendAsyncDefaultNotFound | request.CreateResponse().NotFound().SendAsync() |
SendAsyncDefaultNotAuthenticated | request.CreateResponse().NotAuthenticated().SendAsync() |
1.2.0
Test Coverage (1.2.0)
| Name | Coverage (%) | Covered Lines | Coverable Lines |
|---|---|---|---|
| RestServer.DefaultRequestHandlerImpl | 68.4 % | 13 | 19 |
| RestServer.Endpoint | 100.0 % | 3 | 3 |
| RestServer.EndpointCollection | 100.0 % | 83 | 83 |
| RestServer.Helper.HeaderBuilder | 100.0 % | 26 | 26 |
| RestServer.Helper.UnityNetHelper | 100.0 % | 6 | 6 |
| RestServer.LowLevelHttpServer | 76.9 % | 10 | 13 |
| RestServer.LowLevelHttpSession | 77.7 % | 28 | 36 |
| RestServer.RestRequest | 88.4 % | 69 | 78 |
| RestServer.RestServer | 88.8 % | 48 | 54 |
| RestServer.SpecialHandlers | 100.0 % | 6 | 6 |
| RestServer.ThreadingHelper | 100.0 % | 49 | 49 |
Average: 90.9%
The missing methods to 100% are usually rare error handling code, like socket errors or other low level functionality.
Profile Marker (1.2.0)
Profile markers can be assigned when scheduling a workload via ThreadingHelper.Instance.ExecuteXXX methods like this
ThreadingHelper.Instance.ExecuteAsync(() => {
	transform.position += new Vector3(0.001f, 0.001f, 0.001f);
}, "Position Updates");
These can now be found inside the profiler
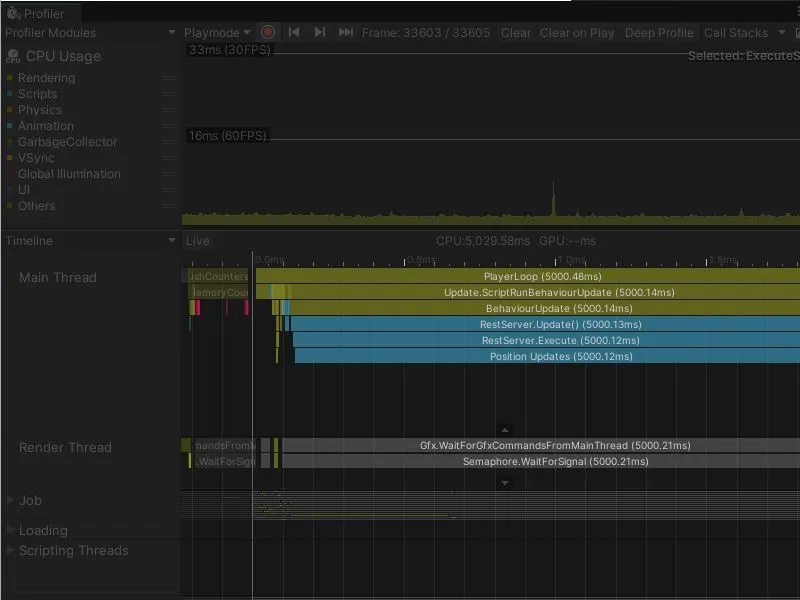
By default, the name of the execute method (e.g. ExecuteSync) is used as the profile marker name.